
Metrics can be viewed at the account level, app level, or Action level.
The default reporting period is the "last 30 days,", however one can change the report start and end date to select any reporting period from the prior year.
One can also export any report to Google Sheets with the "Export" button to the right of the reporting period.

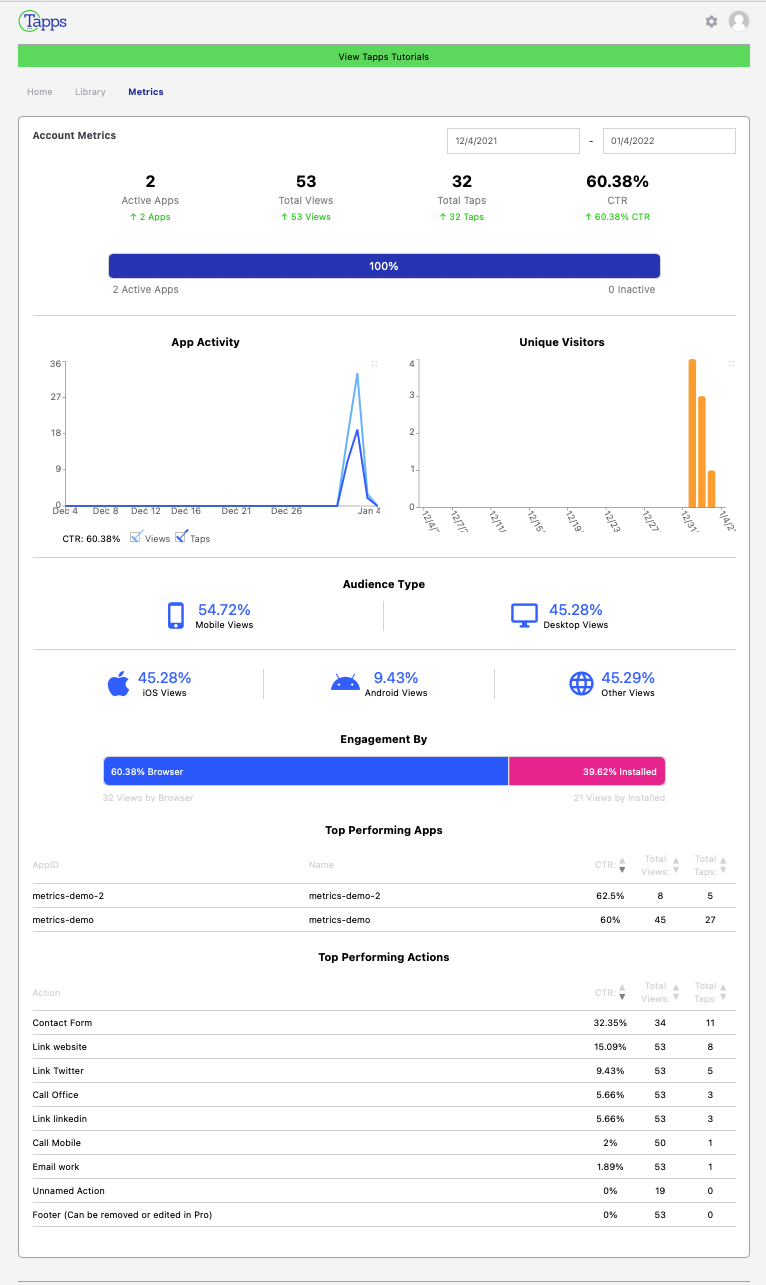
Account Level Metrics
Tap the "Metrics Tab" in the top tab line and see a dashboard such as is shown below. It displays app, page view, and tap activity for the entire account.
"CTR" is the click-through ratio.
Unique visitors reflects a unique device/browser combination. Thus is a user accesses an app on their phone from the Safari browser and then accesses the came app from Chrome on the same phone, these two interactions will be recorded as 2 unique visitors.
Engagement by "browser" versus "installed" is a metric that tracks if your users are using your app (i.e. progressive web app) as a website or if they have installed it and are using it as a an app.
Also see your top performing Apps and your top performing Actions. Remember that one Action can be used in multiple apps, so when viewed from the account level, you are looking at total interactions for that action. (The App level metrics will only show actions interactions for that single App).
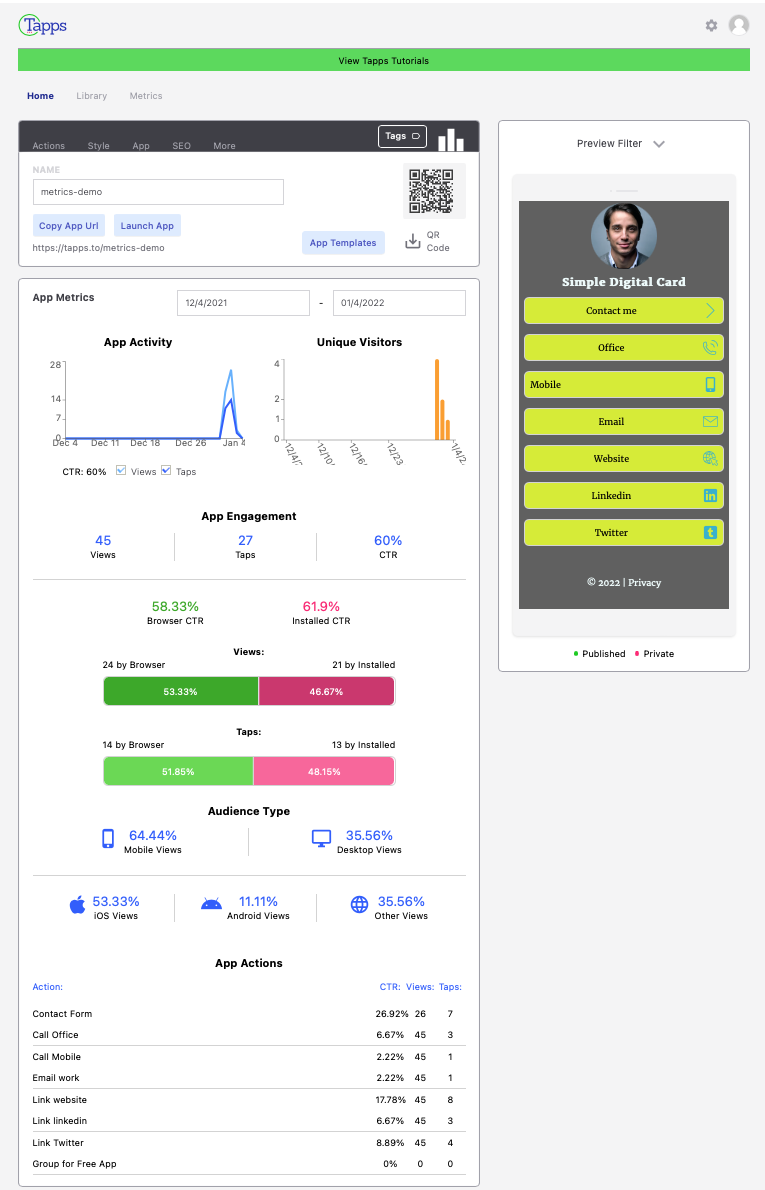
App Level Metrics
Tap the "Metrics Tab" in the app navigation bar to see app level metrics. They are similar to the account metrics, but they only apply to a single app.
For an app, the action list is very useful to see which content in the app is most engaging to users.
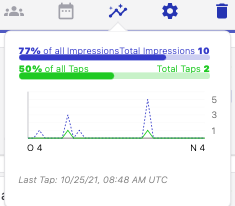
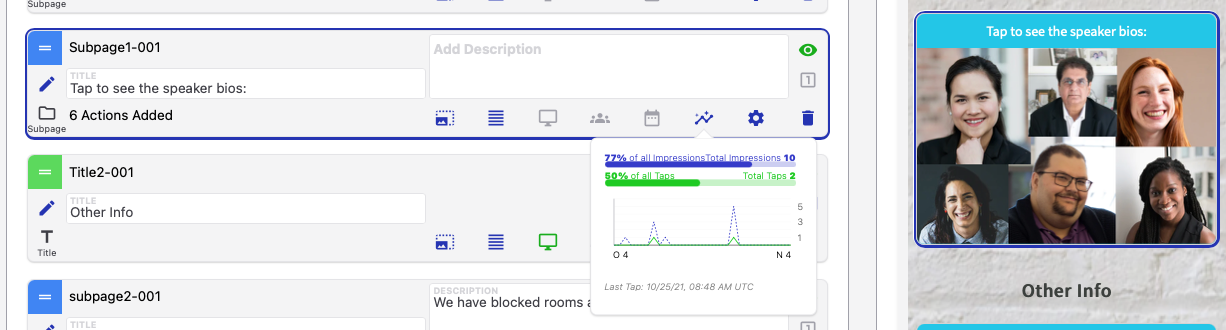
Action level Metrics:
Each use (i.e., instance) of an Action captures metrics, which are accessed from the metrics button on the Actions Quick Edit Module.
Comments
0 comments
Please sign in to leave a comment.